In today's workforce, freelancers and professionals need to focus more on projects. If you become too busy with admin work like creating projects status presentations for clientele, you could lose potential clients. Moreover, it's also true that hiring a data analyst will not be that profitable for individuals or freelancers.
Asana's new reporting tool allows users of any profession to become their own data analysts.
What Is Universal Reporting?
Asana introduced an advanced but easy Universal Reporting tool in their project management software, both the cloud and desktop app. The feature became available from Jun 01, 2021, for the premium plan subscribers of Asana.
This new reporting feature of Asana converts raw project data into graphical charts and graphs that everyone can follow. By using this tool, you won't have to go back and forth with spreadsheets, emails, team chats, one-to-one conversations, or those lengthy video meeting transcripts.
The reporting feature enables you to:
- Line up transparent objectives for your team members or fellow freelance collaborators.
- Efficiently handle any ad-hoc requirement of prioritizing a client’s work.
- Look at the complete productivity status of your teams that no other tool can deliver with a few clicks.
The Universal Reporting tool of Asana ensures that every individual within the team, irrespective of their levels, can prepare a visual representation of their performance metrics. The tool doesn’t require any specialized training. Your team members can easily make their own productivity dashboards by following Asana’s interactive interface.
What Are Its Features?
Asana Universal Reporting comes with a host of features like an overview of dashboards, charts, dashboard sharing, customizations, etc. The followings are the most important features that’ll make your project management life simpler than ever:
1. Charts and Their Variations

The reporting tool offers three types of charts, namely column, donut, and lollipop charts. There is also a fourth chart type, which only shows the total numbers of tasks, resources, items, etc.
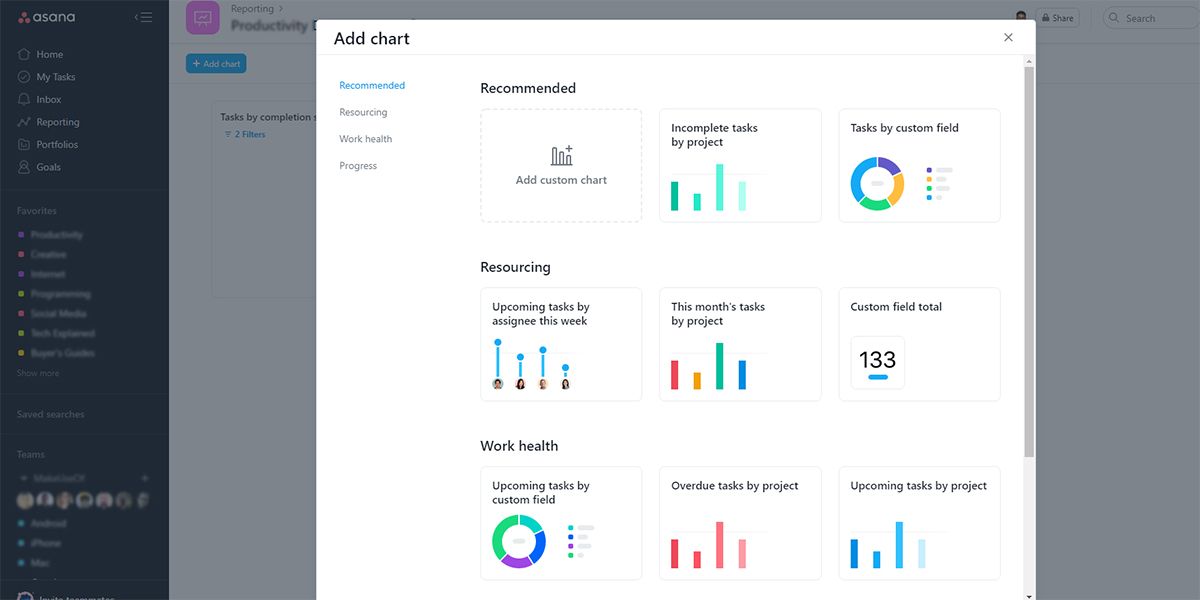
After you create a dashboard in the Asana Reporting section, you can add charts. When you click on Add chart, you’ll see 10 types of chart templates segregated within four sections. The followings chart types are the most popular ones in Asana reporting:
- Tasks by custom field
- Incomplete charts by projects
- This month’s tasks by project
- Overdue tasks by projects
2. A Reporting Dashboard

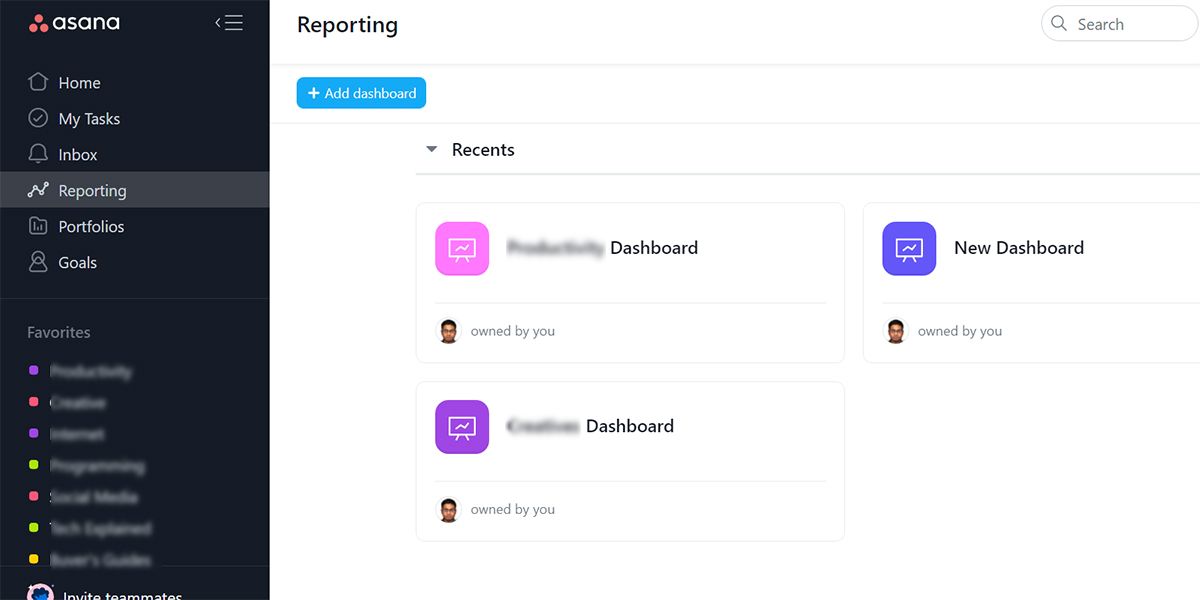
You can access it by clicking on Reporting on the left navigation bar. This dashboard hub gives you the option to add new dashboards or visualize already available ones. If someone from your team shares any dashboards with you, those will also show up here.
It allows you to add any dashboard to the favorites' menu, rename, or delete them.
3. Organizing and Sharing Dashboards

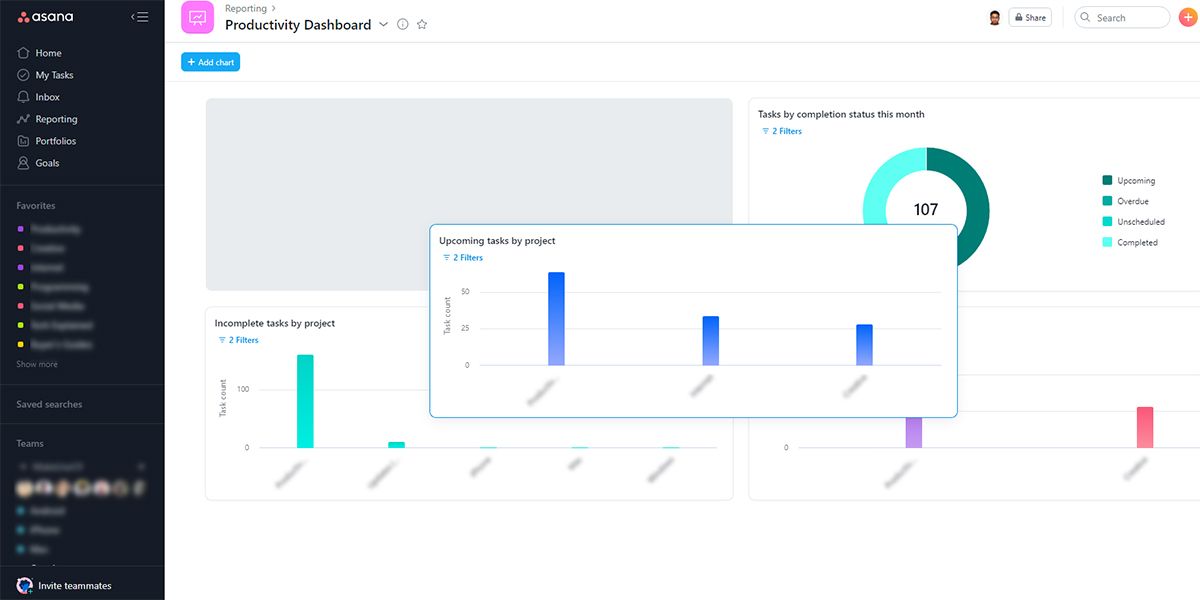
Your project reporting dashboards could house multiple donuts, lollipop, and column charts. However, when you’re exporting data or presenting it to any freelance client, it’s helpful if you’re able to organize them.
Asana reporting gives you the freedom to stack your charts as you see fit through drag-and-drop actions. You can further see underlying data by clicking anywhere within the chart.
You can share reporting dashboards with external and internal project collaborators. Shared reports are read-only. The invitee can only see the underlying data to which they have access. However, all invitees can see overall chart graphics.
4. Customizing Your Charts

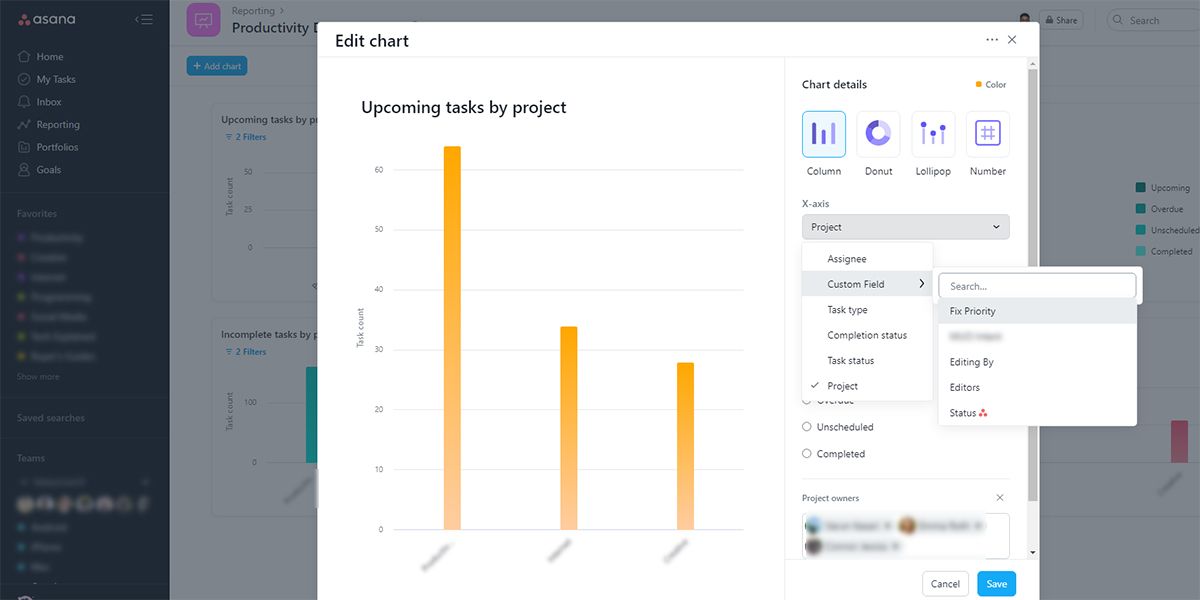
Asana reporting tool offers many chart customization options. You may choose the type of the chart and its color after selecting the project for your report. You can further modify the X-axis and Y-axis data of the graph.
Furthermore, you also get to apply different filters to your charts, like:
- Task completion status
- Project owners
- Assignee
- Subtasks
- Task type
- Task status
- Date
What Are Its Benefits?
The most important advantage of this tool is that it frees you from relying on third-party data analytics software. Now, you can see what’s going on in the team from the Asana all-in-one project management app. The followings are some of the notable benefits that you’ll enjoy when you start using Universal Reporting:
1. Automated Tool for Real-Time Data
The reporting tool automatically rounds up various data from Asana projects. It ensures your team or project dashboards stay up to date without any manual copy-pasting.
You can prepare as many dashboards as you want to segregate multiple teams, projects, or even individual members. You can also create a combined dashboard to visualize the overall performance of your gig.
These custom dashboards allow you to gather all sorts of data from the Asana projects board. A typical chart or dashboard could include data for budget, workload, timing, deadline adherence, tasks, team member’s performance, etc.
2. Find and Resolve Issues Quickly
You need to get a bird’s-eye view of your team resources if you want to manage complex and large projects efficiently. It’s imperative that you need to pinpoint the issues with projects and resources without going through multiple channels.
Universal Reporting enables you to track issues proactively, without waiting for a team member to bring them up. You can truly micromanage each project from one dashboard, to divert resources to the projects running behind schedule.
3. Fair Distribution of Workloads
You can get optimal productivity out of your team if you distribute the workload between the resources. Moreover, delegating tasks to others will give you the time to expand your client list.
The reporting tool of Asana shows resource-wise workload with high precision. You can easily spot under-utilized and burned-out resources to balance workloads. Furthermore, your daily tasks dashboard can help you delegate an important to another team member if you need to attend an urgent client meeting.
4. Better Resource Management
So far, you have been hoping for the best and praying that the cost is manageable before opening an invoice. But, Asana reporting tools now allow you to specifically track each expense of the projects you’re responsible for.
You can discuss with your client to minimize the scope or increase the budget when you’ve got a better view of cash expenses or resource utilization. Ready-to-use charts and dashboard templates for Universal Reporting make resource management effortless.
How Well Is Your Team Working Towards the Goal?
The overall productivity of your projects and the entire business depends on how well the goals align with your team members’ professional objectives.
The Universal Reporting tool is a powerful feature from Asana that helps you see if the teams and projects are aligned. Now that you know how important the reporting tool is, you can use it in the best way possible to manage your project teams.


